Ormissia
Saturday, October 9, 2021
Traefik部署流程
Traefik is an open-source Edge Router that makes publishing your services a fun and easy experience. It receives requests on behalf of your system and finds out which components are responsible for handling them. What sets Traefik apart, besides its many features, is that it automatically discovers the right configuration for your services. The magic happens when Traefik inspects your infrastructure, where it finds relevant information and discovers which service serves which request. Traefik is natively compliant with every major cluster technology, such as Kubernetes, Docker, Docker Swarm, AWS, Mesos, Marathon, and the list goes on; and can handle many at the same time. (It even works for legacy software running on bare metal.) With Traefik, there is no need to maintain and synchronize a separate configuration file: everything happens automatically, in real time (no restarts, no connection interruptions). With Traefik, you spend time developing and deploying new features to your system, not on configuring and maintaining its working state. Developing Traefik, our main goal is to make it simple to use, and we’re sure you’ll enjoy it.
– The Traefik Maintainer Team
结尾附Traefik作为Kubernetes Controller的部署脚本
程序下载
由于Traefik是由Golang语言所编写,程序是二进制包的形式。直接到Traefik在GitHub仓库的releases中下载即可。
我使用的是基于x86的64位Linux系统,所以在这里选择的是linux_amd64版本的包
wget https://github.com/traefik/traefik/releases/download/v2.5.3/traefik_v2.5.3_linux_amd64.tar.gz
解压得到程序
tar -zxvf traefik_v2.5.3_linux_amd64.tar.gz
将程序重命名为traefik并放到/usr/local/bin/目录下
静态配置
静态配置是Traefik在程序启动的时候从配置文件、环境变量或启动参数中加载到内存中的配置参数。如果需要修改,则需要重启Traefik。
根据文档介绍,Traefik会从以下几个目录读取名为traefik.yml(或traefik.yaml或traefik.toml)的静态配置文件:
/etc/traefik/$XDG_CONFIG_HOME/$HOME/.config/.(Traefik程序运行的当前目录)
或者在启动的时候以参数形式指定静态配置文件:
traefik --configFile=foo/bar/myconfigfile.yml
代理端口
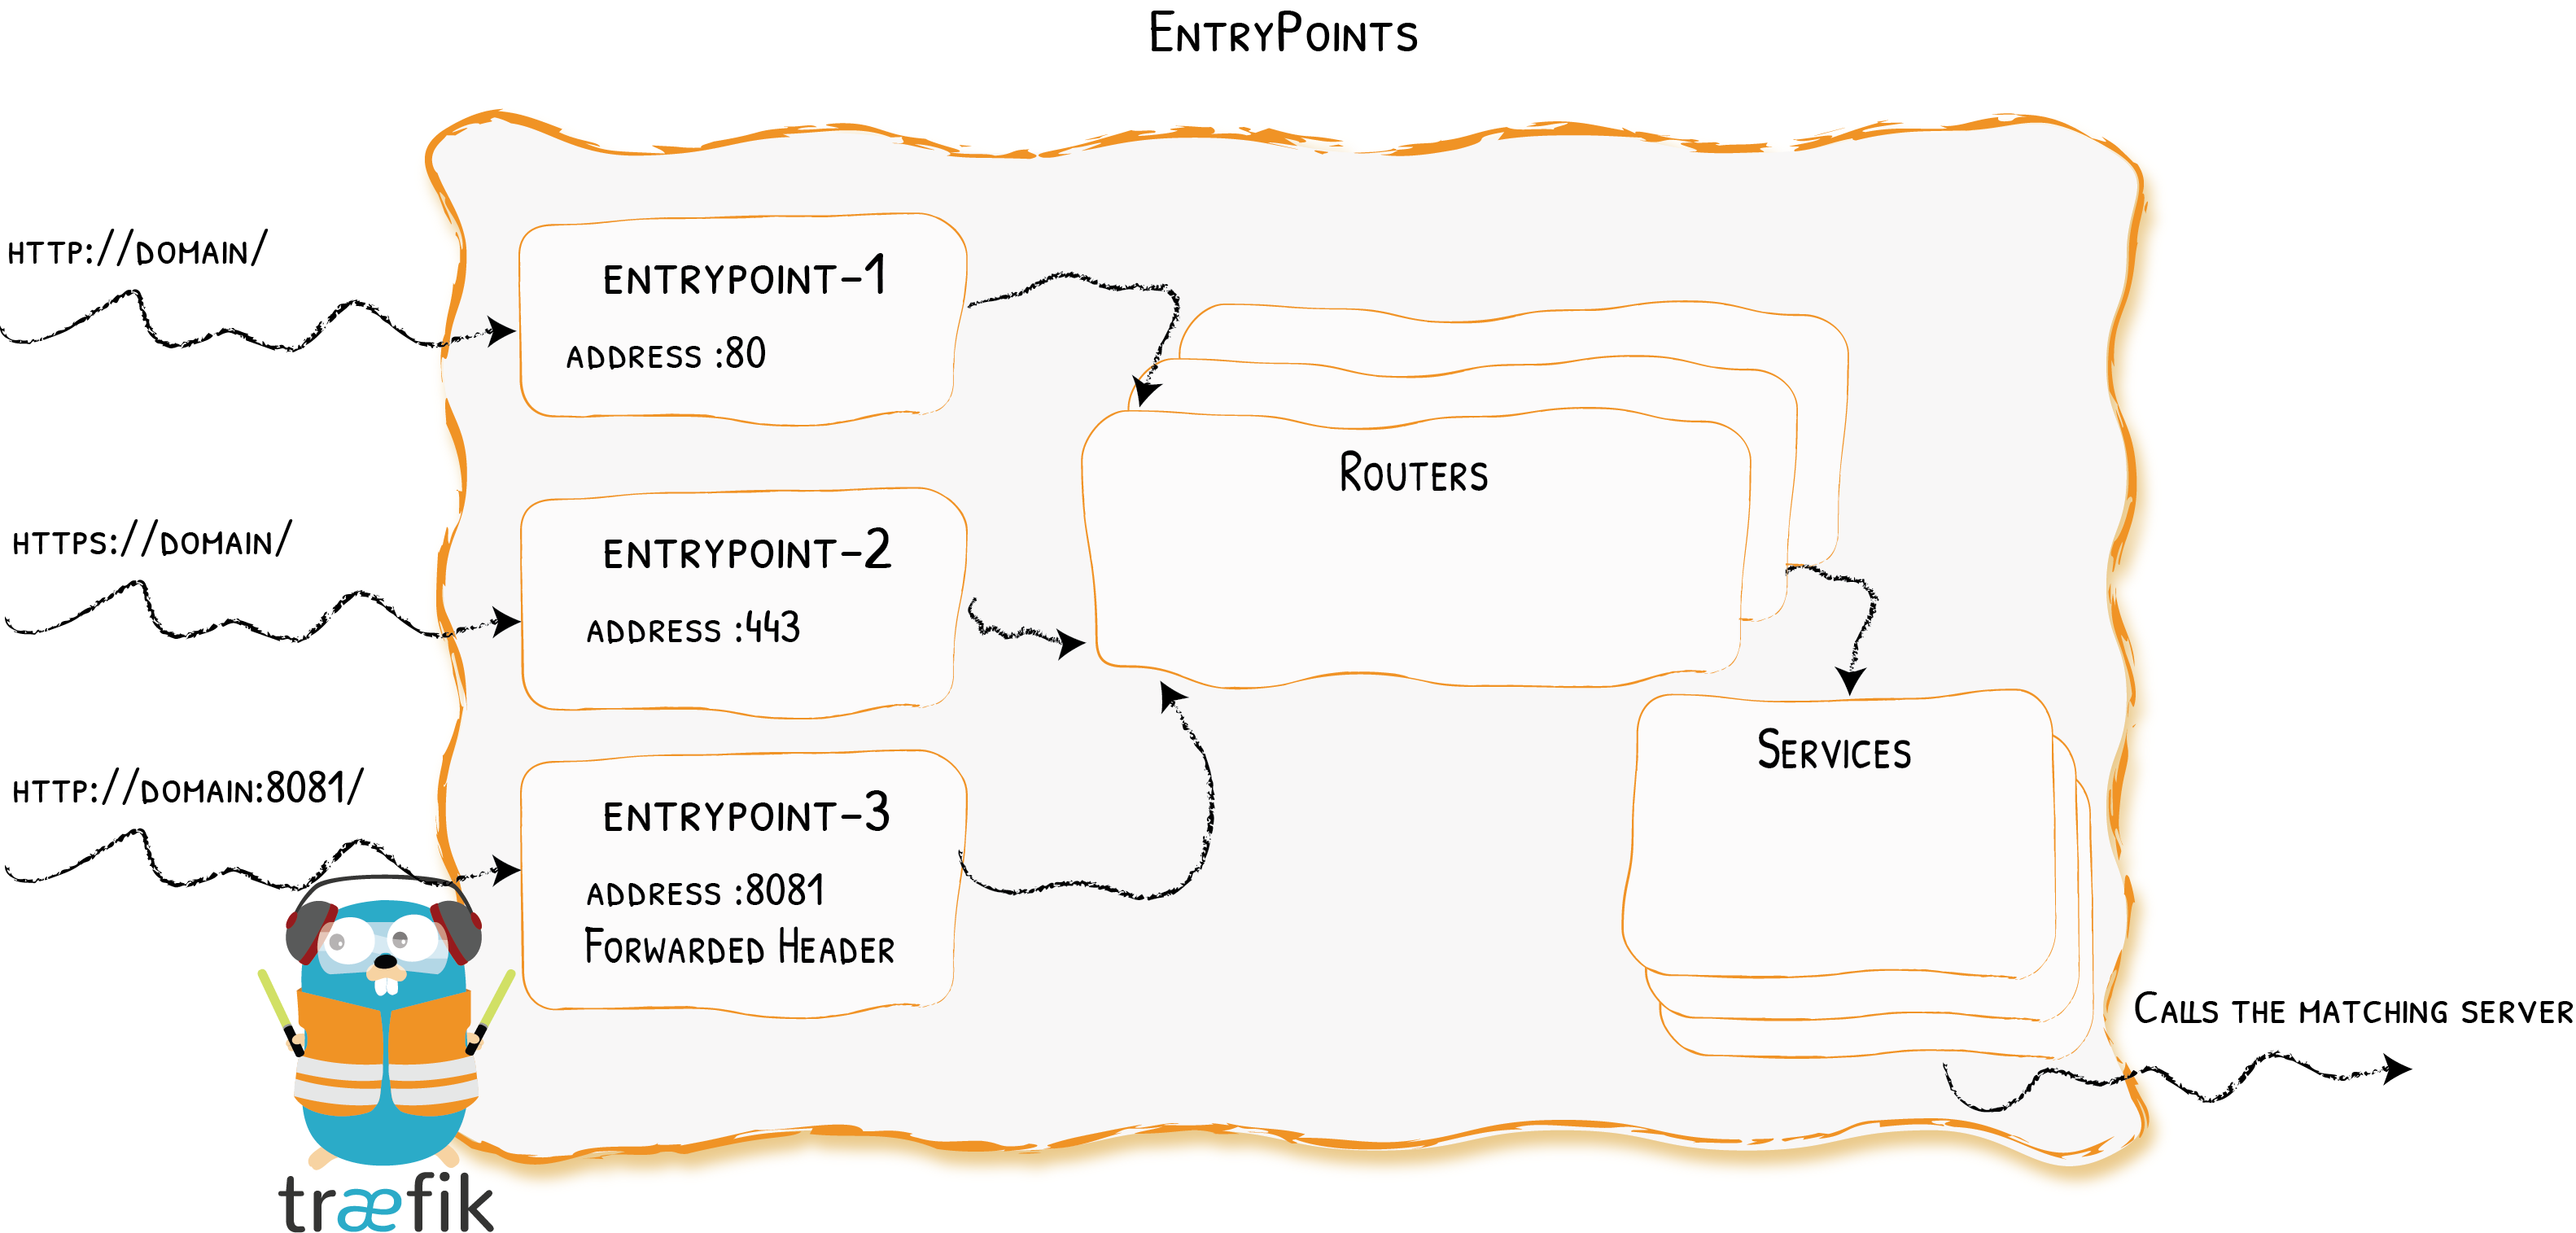
使用entryPoints向外暴露端口
entryPoints:
  web:
    address: ":80"
  websecure:
    address: ":443"
添加动态配置
Traefik支持动态配置,即配置修改后Traefik可以自动重新加载,我在这里选择了从文件读取动态配置,通过providers添加动态配置的配置文件的路径或文件名,在这里我使用了目录的形式(dictory和filename二选一)。
这里也可以修改动态配置的重新加载间隔时间,默认是2S,我在这里使用了默认配置,不做修改。
providers:
  file:
    directory: /etc/traefik/dynamic-conf
    watch: true
开启API
在这里可以开启Traefik的dashboard以及api
api:
  insecure: true
dashboard默认使用的是8080端口,如果要修改,则需要在entryPoints下添加名为traefik的端口配置:
entryPoints:
  traefik:
    address: ":10000"
程序日志
Traefik支持将程序运行的日志输出到文件,通过log标签可以设置日志输出文件,输出格式以及日志级别。
log:
  filePath: /etc/traefik/traefik.log
  format: json
  level: ERROR
访问日志
Traefik支持将访问日志输出到文件,通过accessLog配置
accessLog:
  filePath: /etc/traefik/access.log
  format: json
监控
// TODO
metrics:
  prometheus:
    addRoutersLabels: true
    entryPoint: metrics
动态配置
动态配置中存储的是路由、服务、中间件等配置信息,是可以在程序运行时动态修改的值。
以下是Traefik所支持的动态配置提供者:
| Provider | Type | Configuration Type | Provider Name |
|---|---|---|---|
| Docker | Orchestrator | Label | docker |
| Kubernetes IngressRoute | Orchestrator | Custom Resource | kubernetescrd |
| Kubernetes Ingress | Orchestrator | Ingress | kubernetes |
| Kubernetes Gateway API | Orchestrator | Gateway API Resource | kubernetesgateway |
| Consul Catalog | Orchestrator | Label | consulcatalog |
| ECS | Orchestrator | Label | ecs |
| Marathon | Orchestrator | Label | marathon |
| Rancher | Orchestrator | Label | rancher |
| File | Manual | YAML/TOML format | file |
| Consul | KV | KV | consul |
| Etcd | KV | KV | etcd |
| ZooKeeper | KV | KV | zookeeper |
| Redis | KV | KV | redis |
| HTTP | Manual | JSON format | http |
我在这里选择了
File类型的提供者,以下均为File类型的介绍
路由
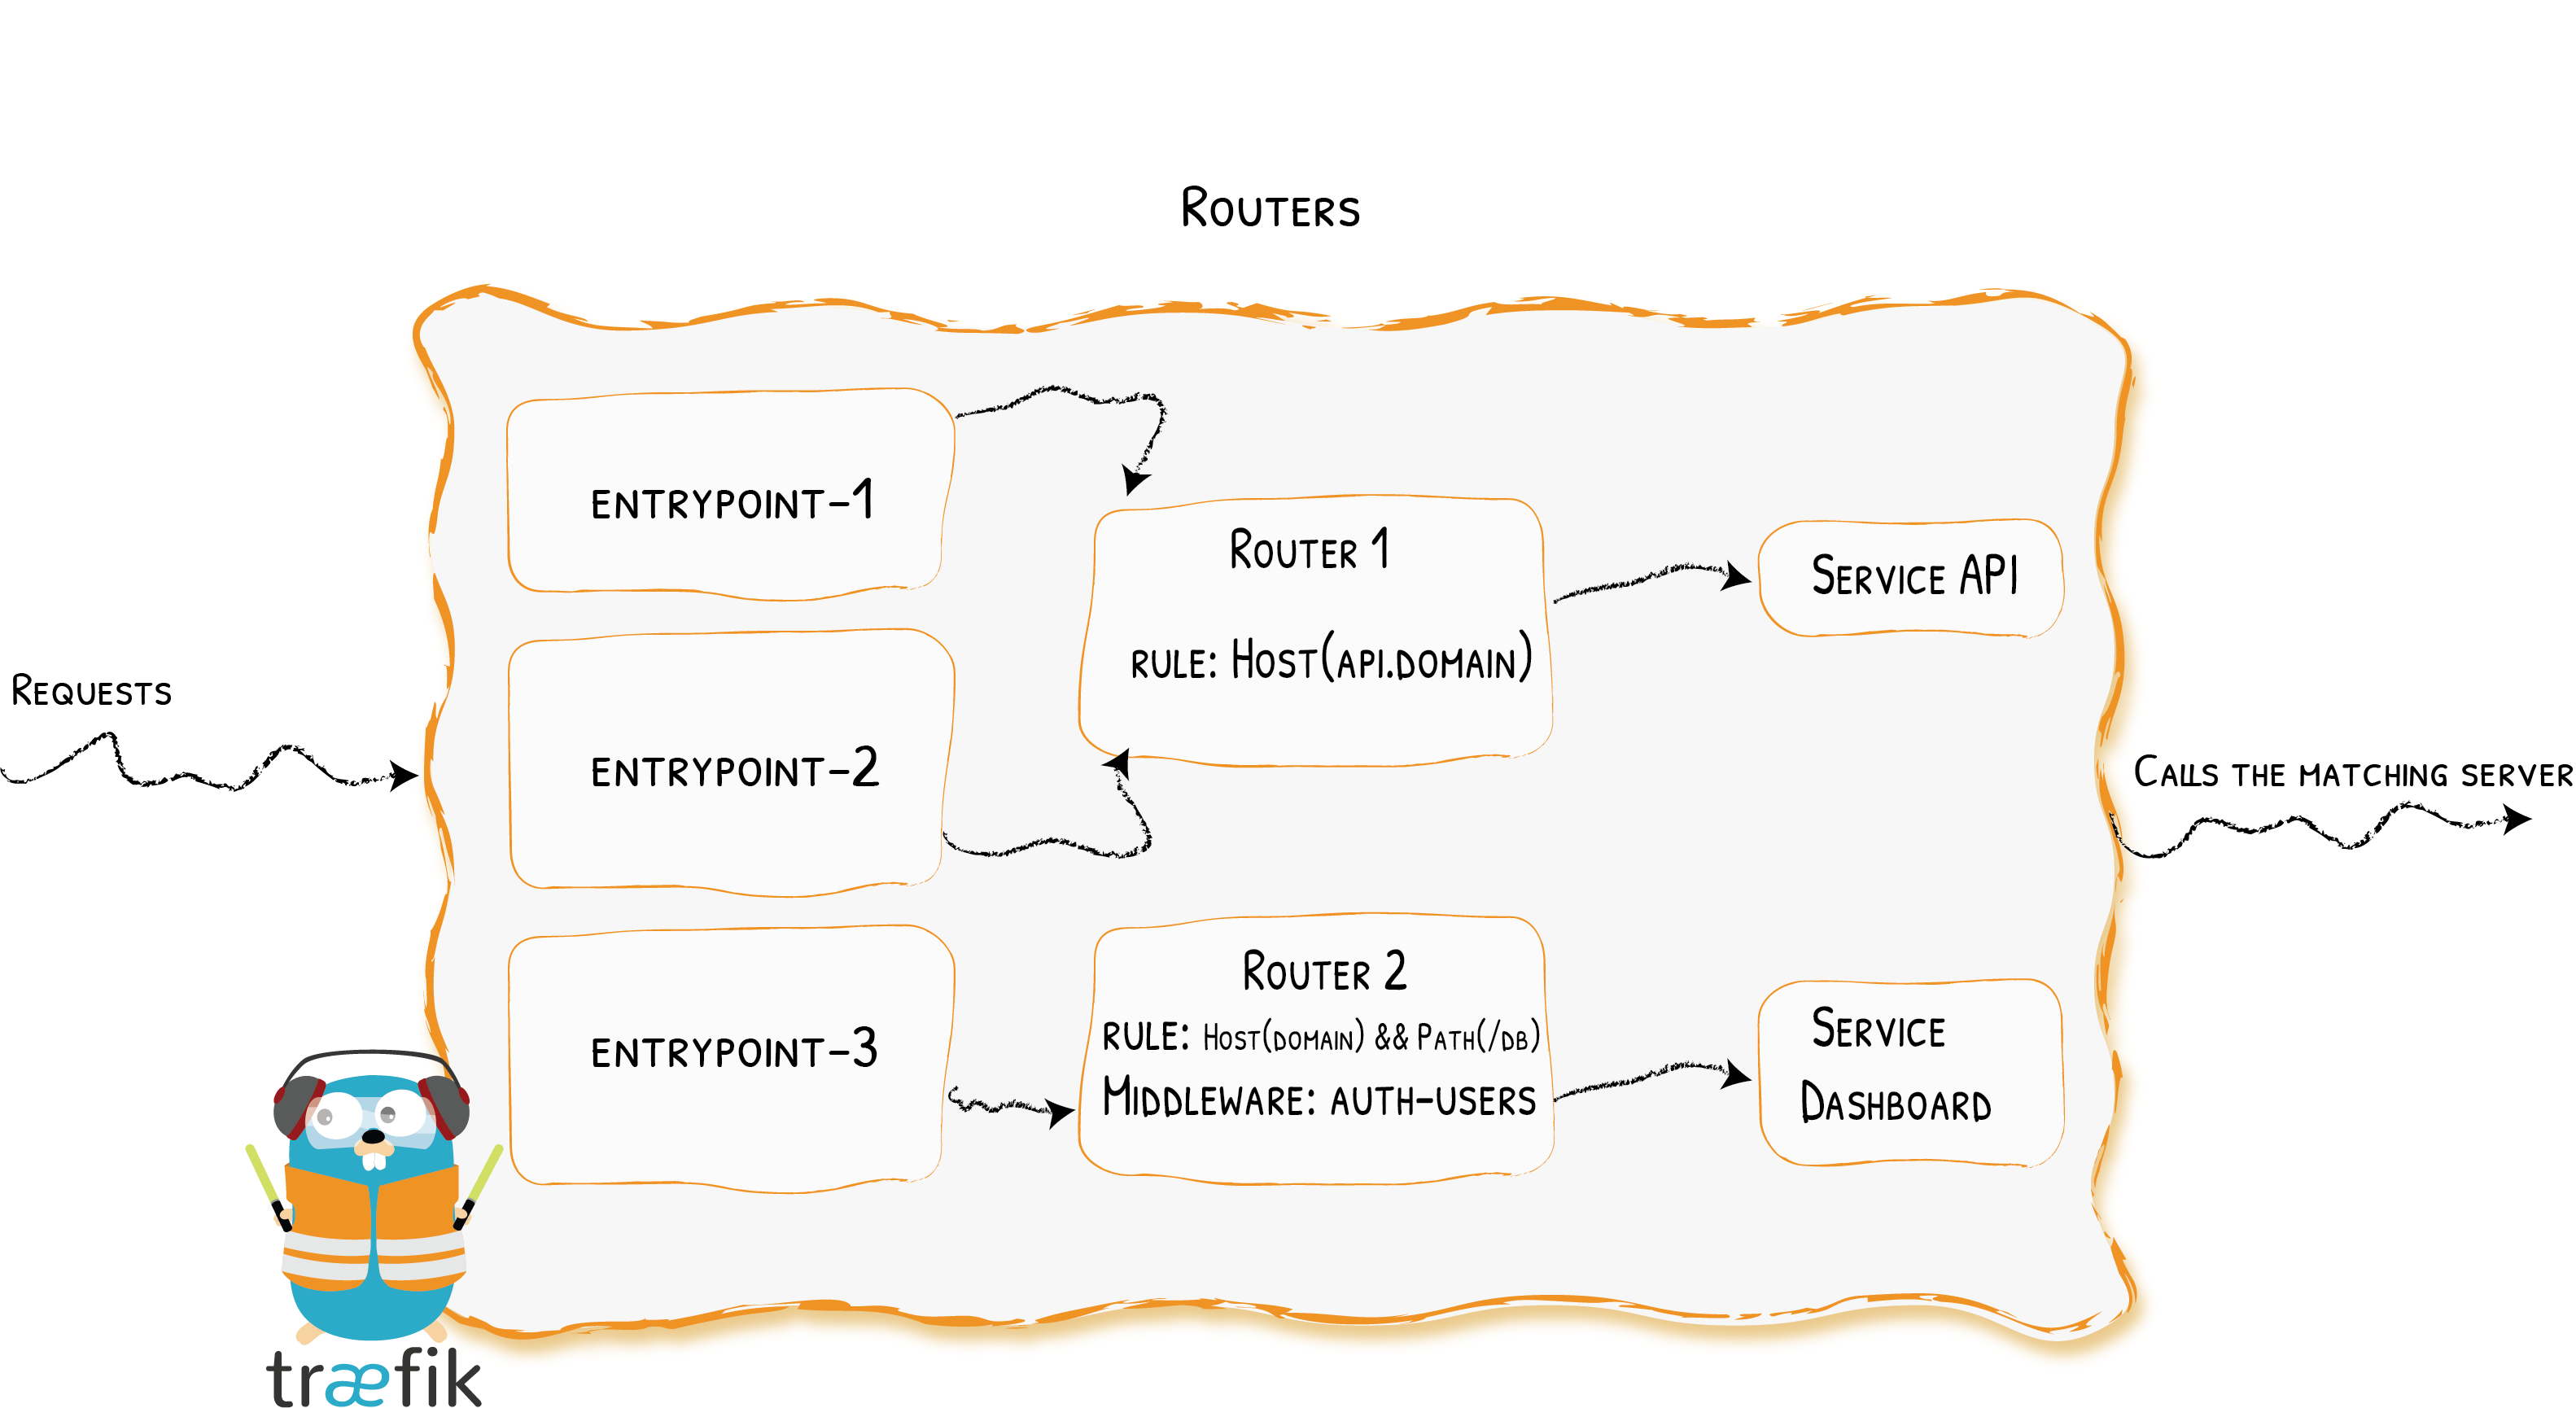
路由类型分为三种,分别为:http、tcp、udp
在这里我使用的是HTTP的路由功能:
http:
  routers:
    router-traefik:
      rule: HostRegexp(`traefik.{domain:.*}`)
      service: traefik
    router-grafana:
      rule: HostRegexp(`grafana.{domain:.*}`)
      service: grafana
service指向的是下面定义的Service的名称
路由规则
路由规则是指,Traefik接收到的请求,根据给定规则路由到不同的服务中。
Traefik一共支持以下规则:
| Rule | Description |
|---|---|
| Headers(`key`, `value`) | Check if there is a key keydefined in the headers, with the value value |
| HeadersRegexp(`key`, `regexp`) | Check if there is a key keydefined in the headers, with a value that matches the regular expression regexp |
| Host(`example.com`, …) | Check if the request domain (host header value) targets one of the given domains. |
| HostHeader(`example.com`, …) | Check if the request domain (host header value) targets one of the given domains. |
| HostRegexp(`example.com`, `{subdomain:[a-z]+}.example.com`, …) | Check if the request domain matches the given regexp. |
| Method(`GET`, …) | Check if the request method is one of the given methods (GET, POST, PUT, DELETE, PATCH, HEAD) |
| Path(`/path`, `/articles/{cat:[a-z]+}/{id:[0-9]+}`, …) | Match exact request path. It accepts a sequence of literal and regular expression paths. |
| PathPrefix(`/products/`, `/articles/{cat:[a-z]+}/{id:[0-9]+}`) | Match request prefix path. It accepts a sequence of literal and regular expression prefix paths. |
| Query(`foo=bar`, `bar=baz`) | Match Query String parameters. It accepts a sequence of key=value pairs. |
| ClientIP(`10.0.0.0/16`, `::1`) | Match if the request client IP is one of the given IP/CIDR. It accepts IPv4, IPv6 and CIDR formats |
我这这里主要会用到HostRegexp和PathPrefix,即对请求url的两种使用正则的过滤规则,前者用于匹配二级域名,后者用于将不同路径的请求转发至不同服务。
这个正则配起来稍微有点小坑,哈哈。我研究了好久才搞明白要怎么写。
为了对Host和Path使用正则表达式,需要声明一个任意命名的变量,然后跟上用冒号分隔的正则表达式,所有这些都用花括号括起来。
示例:HostRegexp(`grafana.{domain:.*}`)
服务
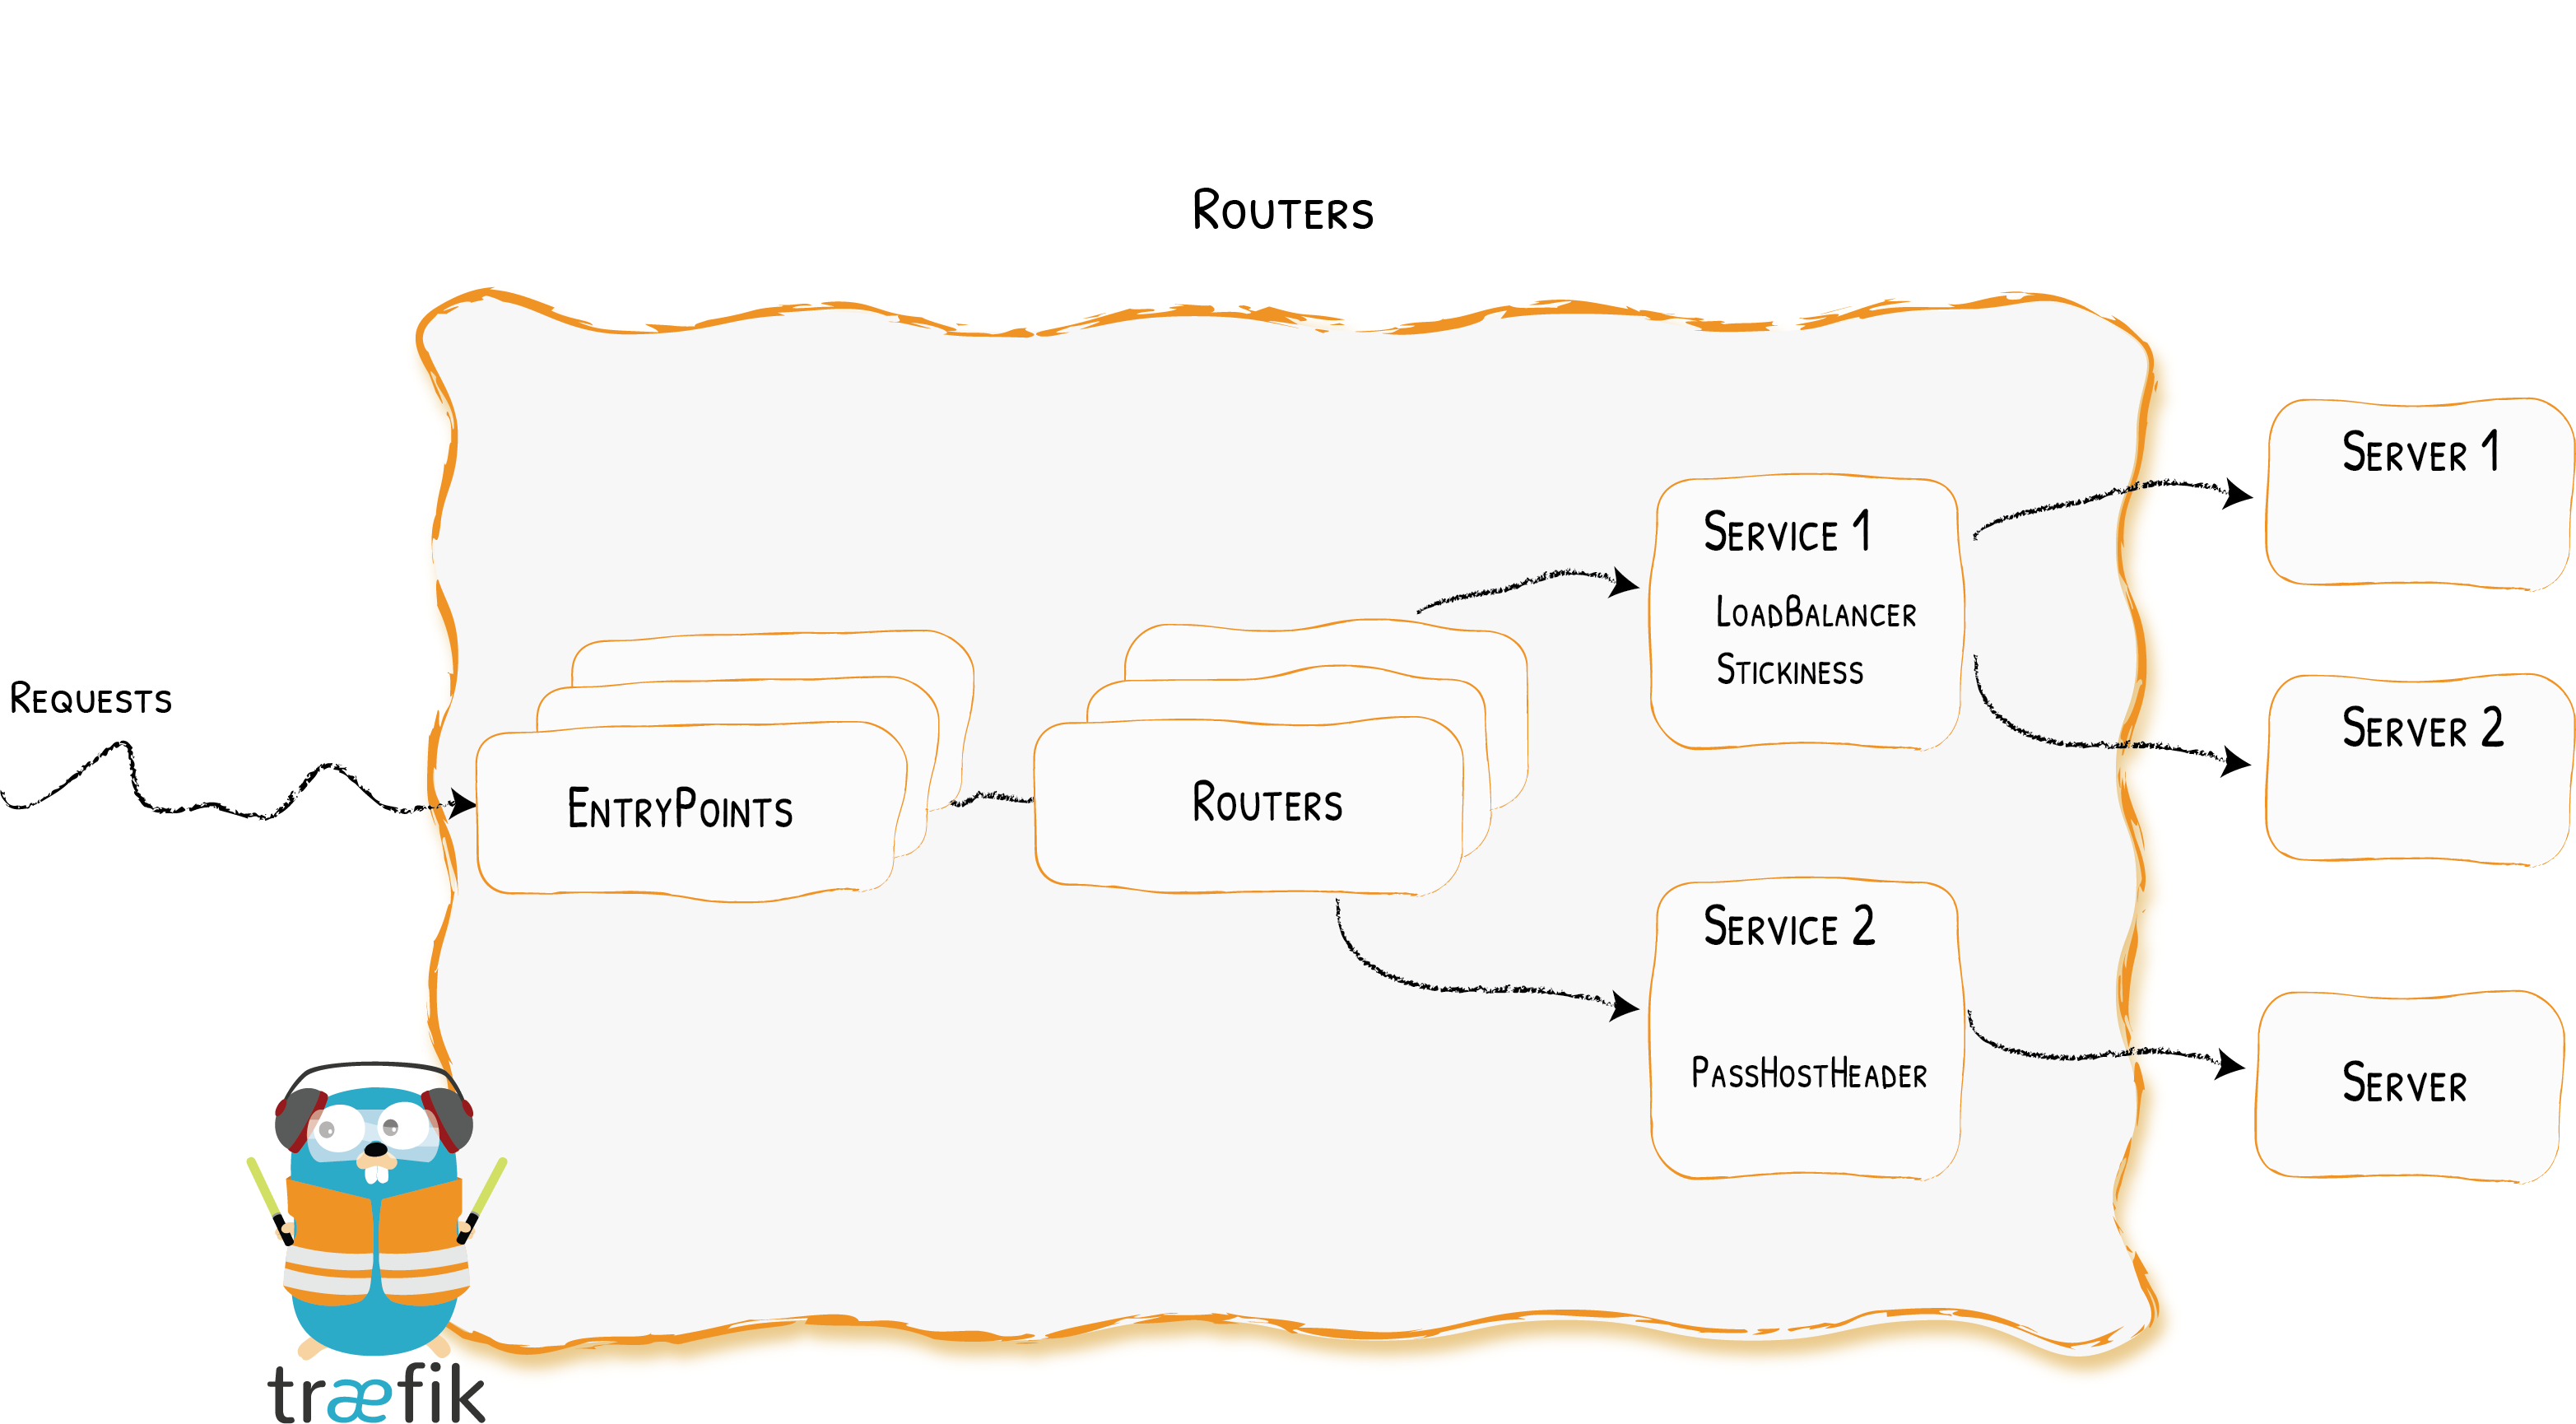
服务负责配置如何到达实际的服务,最终将处理传入的请求。使用service定义:
http:
  services:
    traefik:
      loadBalancer:
        servers:
          - url: "http://127.0.0.1:10000"
我们将上面开启的Traefik的监控面板作为服务封装了起来,只要路由到traefik这个服务上,即可访问监控面板。
在这里也可以实现负载均衡等功能,可以参照官网介绍
开机启动
有了上次部署Nginx的经验,这里我们完全采用
Systemd来管理。即,使用systemctl命令来管理服务。
原理
Systemd默认从目录/etc/systemd/system/读取配置文件。但是,里面存放的大部分文件都是符号链接,指向目录/usr/lib/systemd/system/,真正的配置文件存放在那个目录
systemctl enable命令用于在上面两个目录之间,建立符号链接关系。
systemctl enable traefik.service
# 等同于
ln -s '/usr/lib/systemd/system/traefik.service' '/etc/systemd/system/multi-user.target.wants/traefik.service'
Unit配置文件
下面是Traefik源码仓库中给出的traefik.service 示例,其中有几个需要注意的点:
Type:程序启动方式ExecStart:程序运行的命令,在这里直接指向程序本身WatchdogSec:程序检测时间
[Unit]
Description=Traefik instance
Documentation=https://doc.traefik.io
Wants=network-online.target

[Service]
Environment="ACME_DNS_API_BASE=https://auth.acme-dns.io" "ACME_DNS_STORAGE_PATH=/etc/traefik/acme/dns.json"
# Run traefik as its own user (create new user with: groupadd traefik && useradd -g traefik traefik -s /sbin/nologin)
# User=traefik
# Group=traefik
Type=simple
Restart=on-failure
ExecStart=/usr/sbin/traefik-lb
WatchdogSec=10s
RestartSec=10s

[Install]
WantedBy=multi-user.target
作为服务开启
systemctl start traefik.service
设置开机启动
systemctl enable traefik.service
查看运行状态
systemctl status traefik.service
文件汇总
root
├─ etc
│	└─ traefik
│	 	├─ access.log           // 访问日志
│	 	├─ dynamic_conf         // 动态配置存放文件夹
│	 	│	└─ dynamic_conf.yml // 动态配置文件
│	 	├─ traefik.log          // 程序日志
│	 	└─ traefik.yml          // 静态配置文件
└─ usr
 	└─ local
 	 	└─ bin
 	 	 	└─ traefik          // 程序本身
静态配置
## Static configuration
entryPoints:
  web:
    address: ":80"
  websecure:
    address: ":443"
  traefik:
    address: ":10000"
  metrics:
    address: ":8082"

# 动态配置的配置
providers:
  file:
    directory: /etc/traefik/dynamic-conf
    watch: true

# API
api:
  insecure: true

# 运行日志
log:
  filePath: /etc/traefik/traefik.log
  format: json
  level: ERROR

# 访问日志
accessLog:
  filePath: /etc/traefik/access.log
  format: json

# 监控
metrics:
  prometheus:
    addRoutersLabels: true
    entryPoint: metrics
动态配置
## Dynamic configuration
http:
  routers:
    router-traefik:
      rule: HostRegexp(`traefik.{domain:.*}`)
      service: traefik
    router-grafana:
      rule: HostRegexp(`grafana.{domain:.*}`)
      service: grafana
    router-prometheus:
      rule: HostRegexp(`prometheus.{domain:.*}`)
      service: prometheus

  services:
    traefik:
      loadBalancer:
        servers:
          - url: "http://127.0.0.1:10000"
    grafana:
      loadBalancer:
        servers:
          - url: "http://127.0.0.1:3000"
    prometheus:
      loadBalancer:
        servers:
          - url: "http://127.0.0.1:9090"
至此,我们已经配置完成了Traefik的基础功能,实现了路由,日志,开机启动等功能
中间件
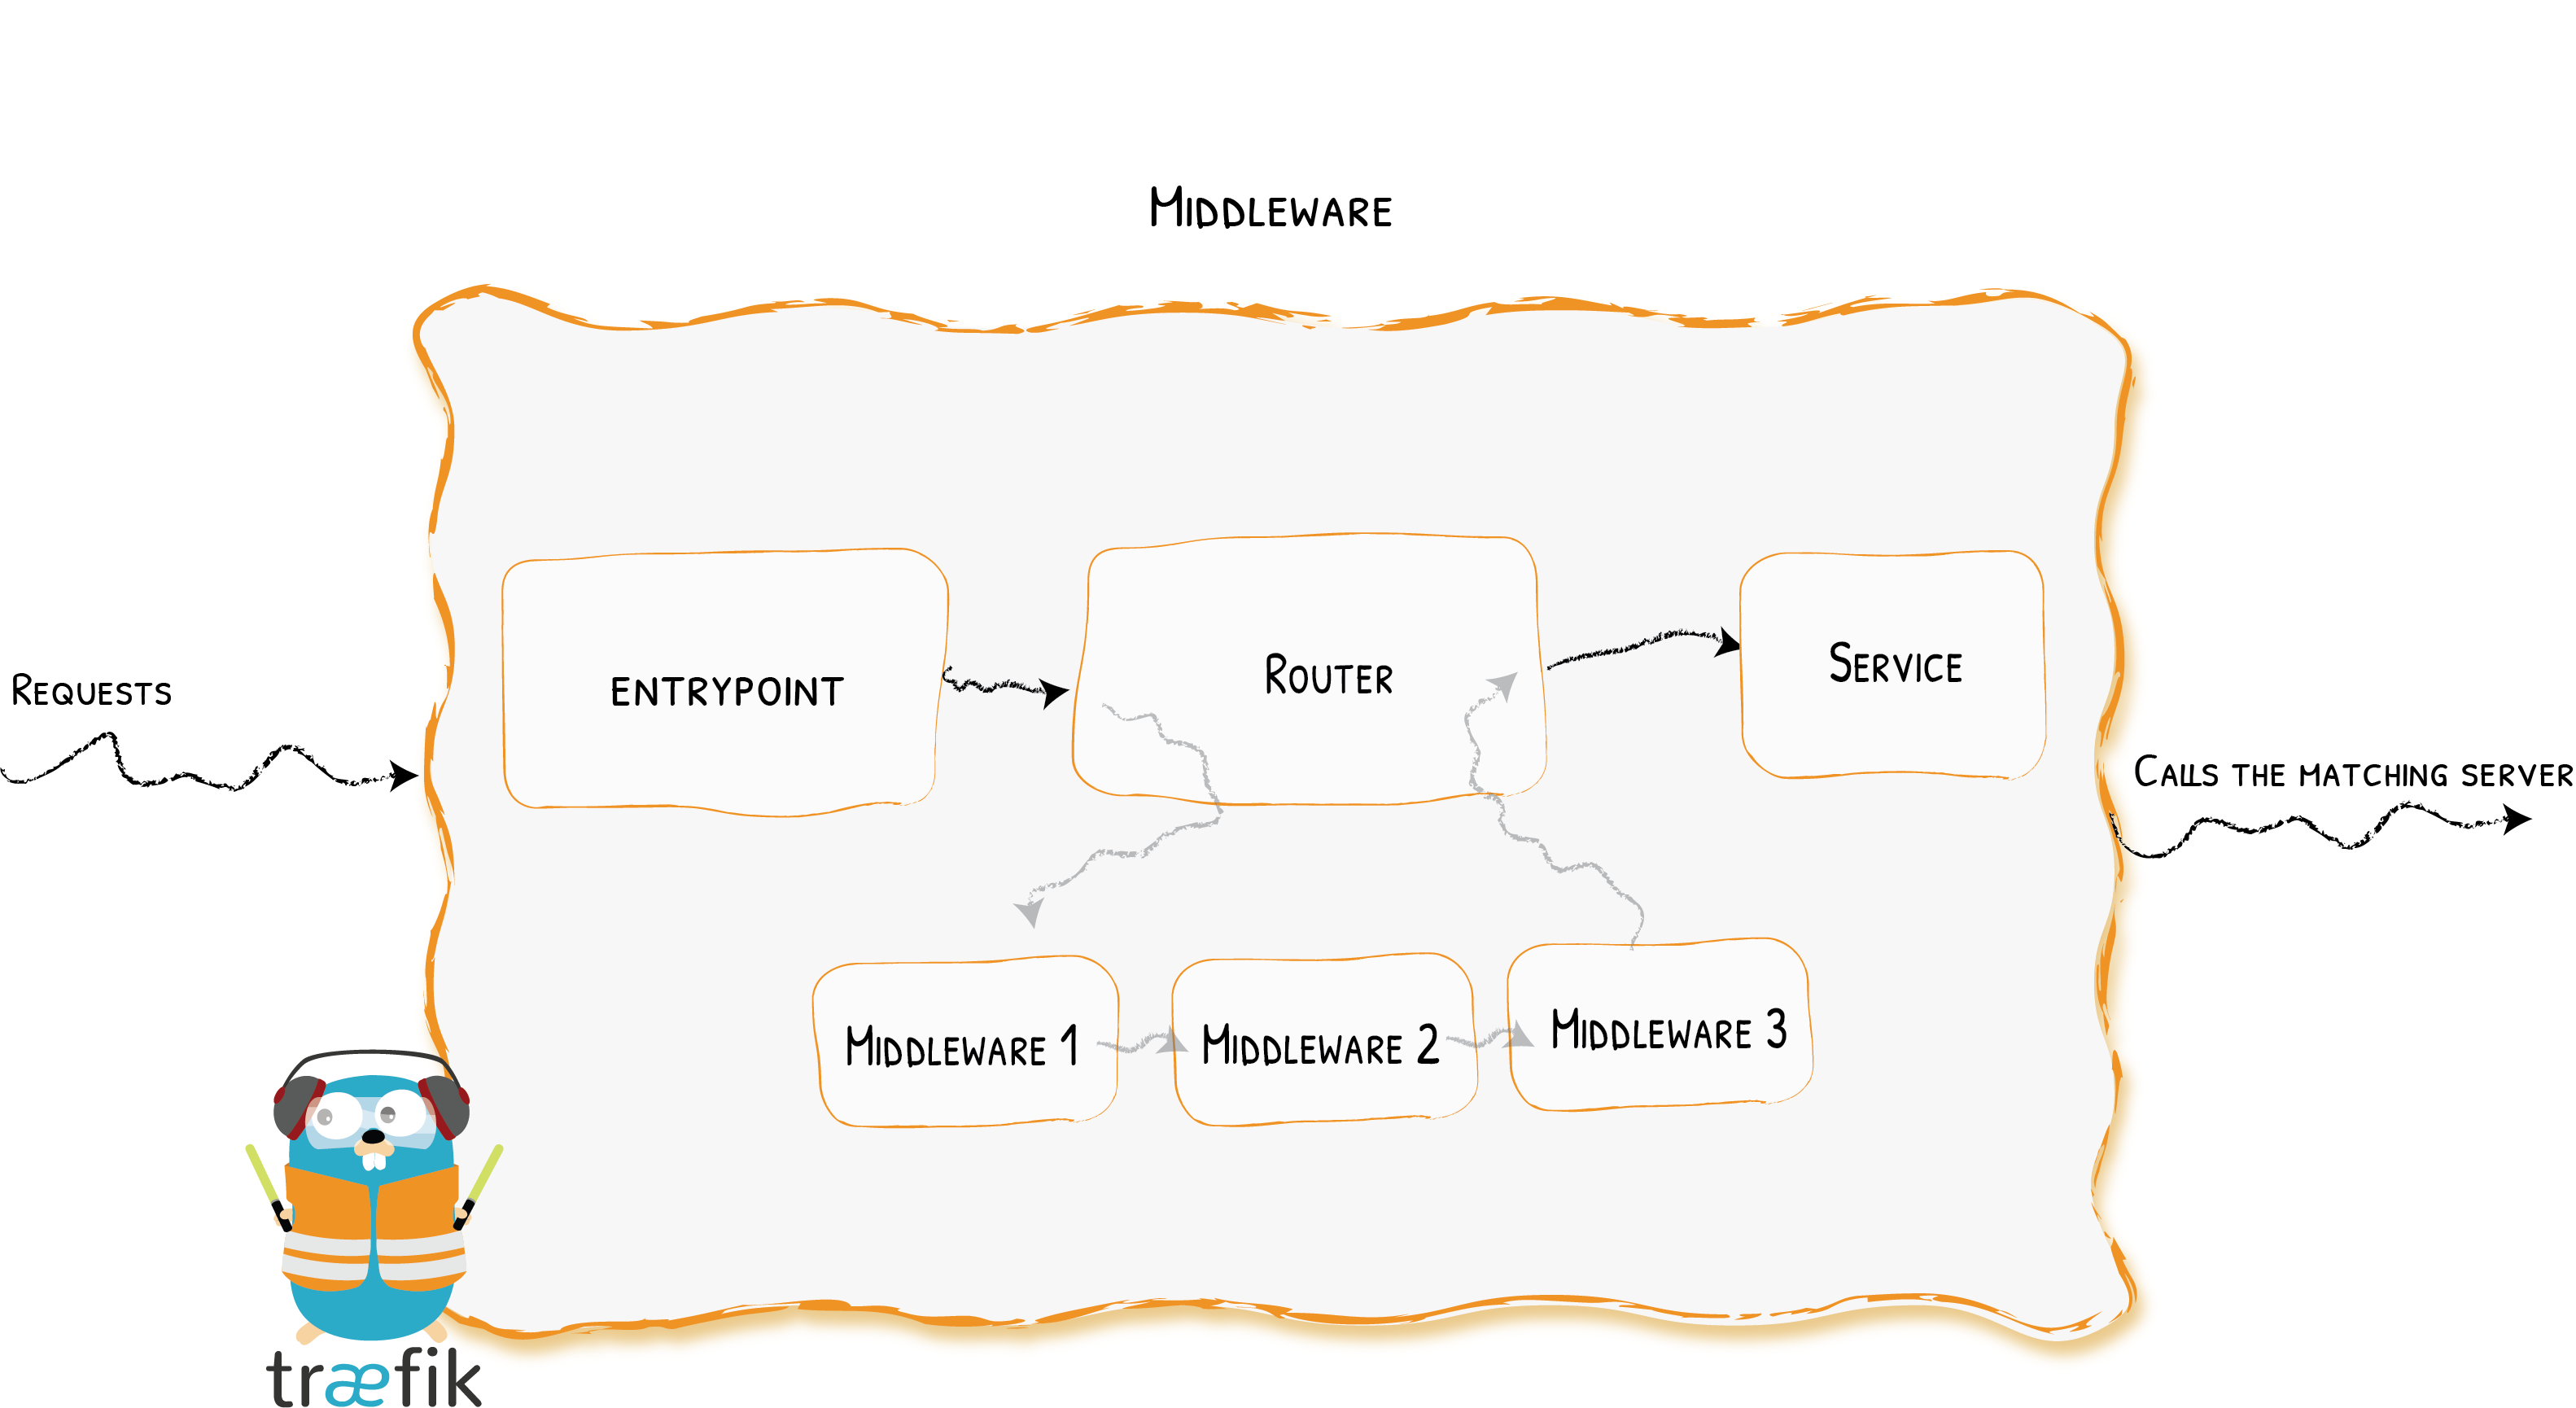
从图中基本可以明白中间件的作用,也可以理解成拦截器,亦或者是类似于
Spring中的切面。
Traefik中有几种可用的中间件:一些可以修改请求、请求头,一些负责重定向,一些可以添加身份验证等等。
中间件的配置格式类似于Service,大致是先定义,再使用。
下面是一个官网给出的示例:
# As YAML Configuration File
http:
  routers:
    router1:
      service: myService
      middlewares:
        - "foo-add-prefix"
      rule: "Host(`example.com`)"

  middlewares:
    foo-add-prefix:
      addPrefix:
        prefix: "/foo"

  services:
    service1:
      loadBalancer:
        servers:
          - url: "http://127.0.0.1:80"
页面访问认证

由于Traefik的管理页面给有给出登录的功能,因此这里使用官方提供的BasicAuth中间件来实现访问认证的功能。
定义权限认证中间件
定义名为traefik-auth的中间件:
## Dynamic configuration
http:

# ...

  middlewares:
    traefik-auth:
      basicAuth:
        users:
          - "test:$apr1$cxKgflNX$3PWH2/iPEdZrBEWYGfSBm."
user下面的密码使用htpasswd生成
给对应路由添加中间件
给路由添加中间件
## Dynamic configuration
http:
  routers:
    router-traefik:
      middlewares:
        - traefik-auth
      rule: Host(`traefik.ormissia.com`)
      service: traefik
这样在访问相应路由的时候会经过basicAuth的中间件,在浏览器弹出窗口输入之前使用htpasswd生成的用户名密码即可。
配置获取免费证书
在这里我面选择让Traefik自动获取免费证书,并且申请泛域名的证书。
端口重定向
将80端口的流量重定向到443端口,并开启http代理的tls
## Static configuration
entryPoints:
  web:
    address: ":80"
    http:
      redirections:
        entryPoint:
          to: websecure
          scheme: https
  websecure:
    address: ":443"
    http:
      tls: {}
这个时候我们将80代理到了443,因此访问页面会显示成这样:

接下来我们给Traefik添加自动获取证书的功能
开启ACME
# certificate
certificatesResolvers:
  myresolver:
    acme:
      email: example@email.com
      storage: /etc/traefik/acme/acme.json
      dnsChallenge:
        provider: acme-dns
这里面有三个属性是必填的:
email:邮箱storage:证书存储文件dnsChallenge:由于我们选择申请泛域名的证书,目前只有dnsChallenge支持申请泛域名。
storage
创建一个文件,权限必须是600,里面主要用来存证书的信息,信息格式为json。
cd /etc/traefik/acme/
touch acme.json && chmod 600 acme.json
dnsChallenge
dnsChallenge支持各种不同的provider,具体可以参考官网介绍,这里就不再贴了。
如果自己的域名在表格中有对应的云厂商,可以使用对应的provider。这里虽然我使用的这个域名是阿里云上的,只是感觉创建token或者RAM账户有点难于管理,而且要设置一些权限等等。
因此这里我选择了通用的方式,使用acme-dns作为provider。
使用acme-dns作为provider,需要添加两个环境变量:
ACME_DNS_API_BASE:这里我使用了acme-dns官方提供的地址-https://auth.acme-dns.ioACME_DNS_STORAGE_PATH:这个文件存储了从上一个url中获取的DNS信息,需要手动创建一下
由于未知原因,这里我在/etc/profile中添加对应环境变量并且使用source编译之后,Traefik运行时候未能正确读取到,因此我选择将两个变量写入systemd的配置文件中:
vi /usr/lib/systemd/system/traefik.service
[Unit]
# ...

[Service]
Environment="ACME_DNS_API_BASE=https://auth.acme-dns.io" "ACME_DNS_STORAGE_PATH=/etc/traefik/acme/dns.json"
# ...

[Install]
# ...
直接在服务的配置文件中添加,这样在Traefik启动的时候就能正确读取到两个环境变量了。
添加CNAME解析
当完成上面的配置之后,运行一下Traefik之后,/etc/traefik/acme/dns.json会获得对应信息:
{
  "ormissia.com":{
    "fulldomain":"123.auth.acme-dns.io",
    "subdomain":"123",
    "username":"123",
    "password":"123",
    "server_url":"https://auth.acme-dns.io"
  }
}
取fulldomain的值,到自己的域名管理添加一条CNAME类型的解析:_acme-challenge.ormissia.com指向上面得到的fulldomain的值即可。
等待片刻执行下面命令查看解析是否成功:
dig _acme-challenge.ormissia.com
可以看到返回值中有这样一行:
;; ANSWER SECTION:
_acme-challenge.ormissia.com. 600 IN	CNAME	123.auth.acme-dns.io.
即代表解析成功。
重启Traefik之后,刷新页面,即可以从浏览器中看到证书获取成功。

Kubernetes部署脚本
RBAC
# rbac.yml
---
kind: ClusterRole
apiVersion: rbac.authorization.k8s.io/v1
metadata:
  name: traefik-ingress-controller
rules:
  - apiGroups:
      - ""
    resources:
      - services
      - endpoints
      - secrets
    verbs:
      - get
      - list
      - watch
  - apiGroups:
      - extensions
      - networking.k8s.io
    resources:
      - ingresses
      - ingressclasses
    verbs:
      - get
      - list
      - watch
  - apiGroups:
      - extensions
    resources:
      - services
      - endpoints
      - ingresses/status
    verbs:
      - update
      - get
      - list
      - watch

---
kind: ClusterRoleBinding
apiVersion: rbac.authorization.k8s.io/v1
metadata:
  name: traefik-ingress-controller
roleRef:
  apiGroup: rbac.authorization.k8s.io
  kind: ClusterRole
  name: traefik-ingress-controller
subjects:
  - kind: ServiceAccount
    name: traefik-ingress-controller
    namespace: kube-basic
Deployment&Service
# traefik.yml
apiVersion: v1
kind: ServiceAccount
metadata:
  name: traefik-ingress-controller

---
kind: Deployment
apiVersion: apps/v1
metadata:
  name: traefik
  labels:
    app: traefik

spec:
  replicas: 3
  selector:
    matchLabels:
      app: traefik
  template:
    metadata:
      labels:
        app: traefik
    spec:
      serviceAccountName: traefik-ingress-controller
      affinity:
        podAntiAffinity:
          preferredDuringSchedulingIgnoredDuringExecution:
            - podAffinityTerm:
                topologyKey: kubernetes.io/hostname
                labelSelector:
                  matchExpressions:
                    - key: app
                      operator: In
                      values:
                        - traefik
              weight: 100
      containers:
        - name: traefik
          image: traefik
          ports:
            - name: web
              containerPort: 80
          resources:
            limits:
              cpu: 20m
              memory: 150Mi
            requests:
              cpu: 5m
              memory: 70Mi
          args:
            - --entrypoints.web.address=:80
            - --entrypoints.web.http.redirections.entryPoint.to=websecure
            - --entrypoints.web.http.redirections.entryPoint.scheme=https
            - --entrypoints.websecure.address=:443
            - --providers.kubernetesingress
            - --providers.kubernetesingress.namespaces=kube-basic,kubernetes-dashboard
            - --log.level=INFO
            - --accesslog
            - --api.insecure=true
            - --pilot.token=1f36db5d-9f2c-42da-8737-4cf8979de6a4

---
apiVersion: v1
kind: Service
metadata:
  name: traefik
spec:
  type: NodePort
  selector:
    app: traefik
  ports:
    - protocol: TCP
      port: 80
      name: web
      targetPort: 80
      nodePort: 30000
    - protocol: TCP
      port: 8080
      name: admin
      targetPort: 8080
      nodePort: 30001
Ingress
# ingress.yml
kind: Ingress
apiVersion: networking.k8s.io/v1
metadata:
  name: whoami-ingress
  annotations:
    traefik.ingress.kubernetes.io/router.entrypoints: web

spec:
  rules:
    - host: traefik.ormissia.com
      http:
        paths:
          - path: /
            pathType: Prefix
            backend:
              service:
                name: traefik
                port:
                  number: 8080