Ormissia
Wednesday, September 22, 2021
Grafana上监控kubernetes中Pod已用内存不准问题分析
结合上次Golang服务内存增长的分析,近期线上多个服务出现内存持续增长的问题,就这个现象分析一下Prometheus+Grafana的监控问题
#kubernetes #k8s #内存分析 #oom #golang #grafana
问题现象
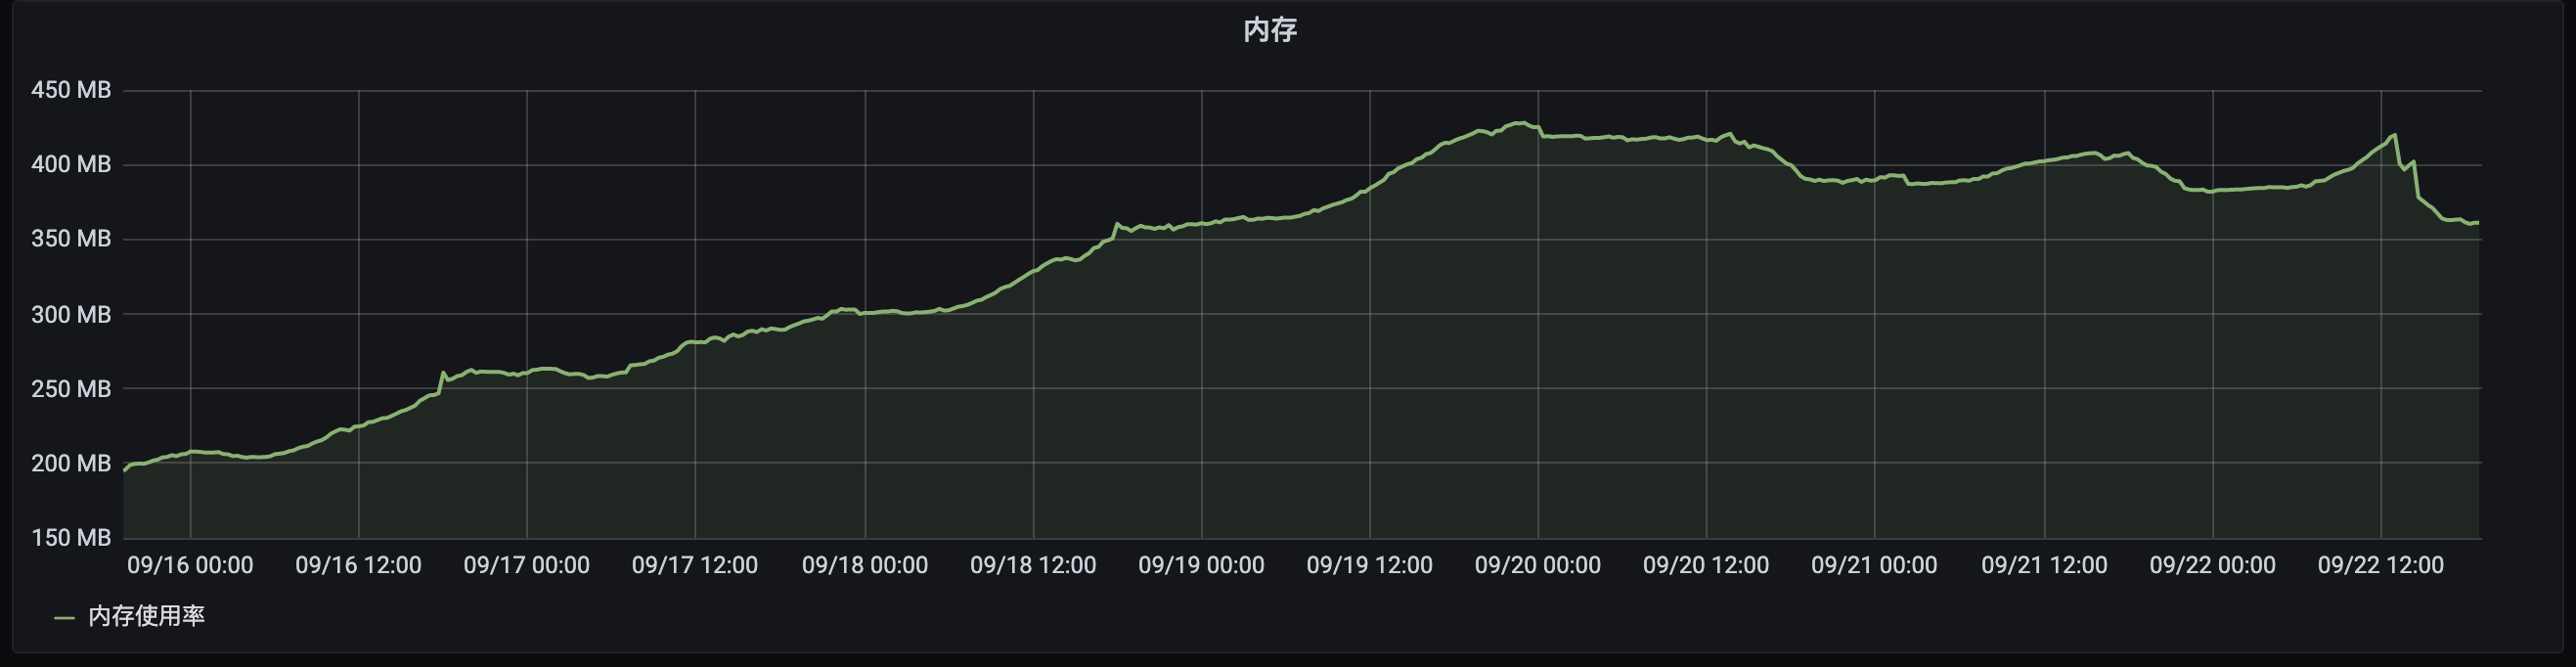
近期在Grafana上显示生产环境多个服务出现内存持续增长的问题,有Golang的服务,也有JAVA的服务。都是服务重启之后,内存来到一个最低水平, 随着服务运行时间增长,pod的内存占用也随之水涨船高。直到内存占用增长到pod限制的上限附近,内存才出现回收的迹象,并且回收幅度不是特别明显, 但同时又不会出现OOM。
Golang某个服务内存占用情况
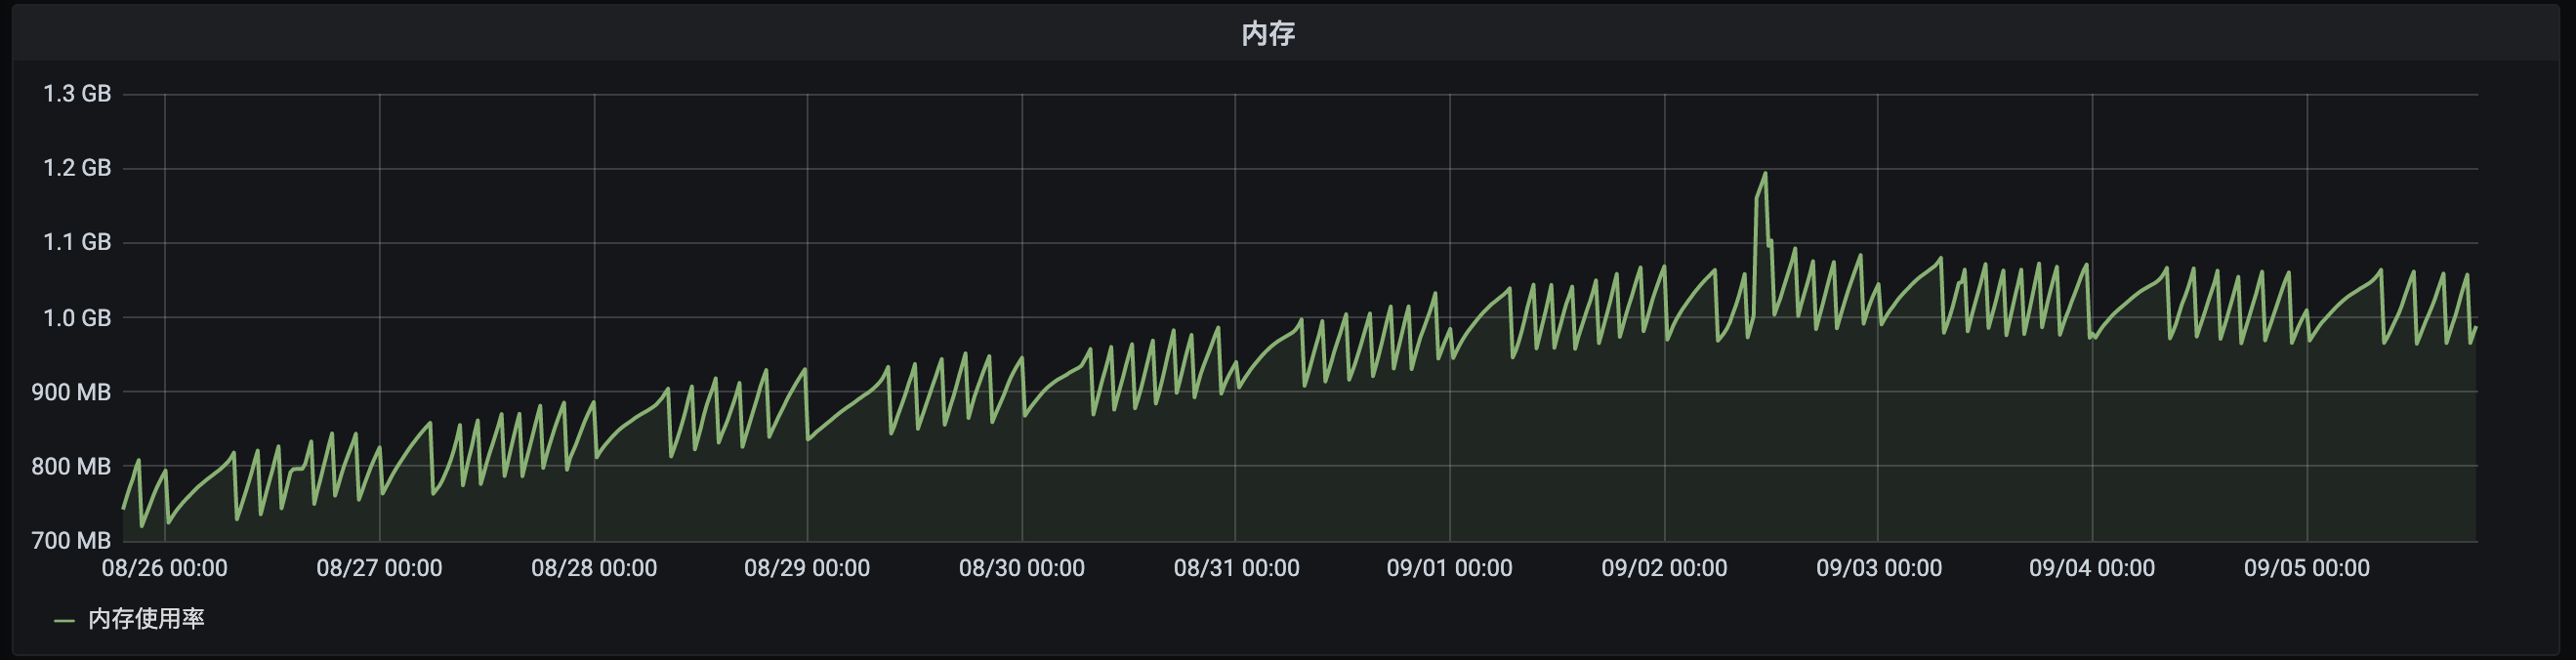
JAVA某个服务内存占用情况
简单分析
记一次线上的内存持续增长问题
↑这个是初次遇到这个问题时候的分析,当时以为是代码写的有漏洞,程序发生了内存泄漏。于是祭出了pprof分析了一顿,结果可想而知,当然是没看出有问题。
现在是多个服务都出现类似问题,那这个情况相对也就比较值得重视了。之前那个服务是因为日志写的比较多,造成磁盘IO比较大。同样的,
近期发现的这几个内存持续不断增长的服务也都是日志量比较大的。
进一步分析
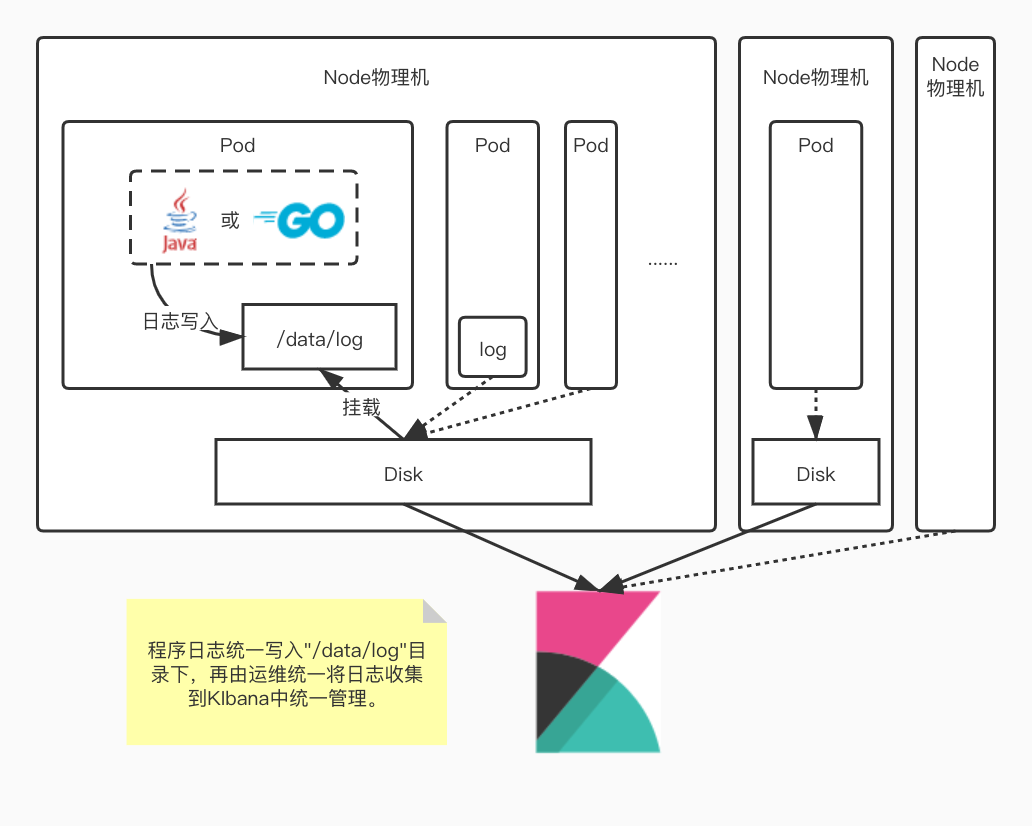
集群日志架构
所有pod中的日志都是写入挂载到/data/log目录的物理机磁盘中,因此所有写日志的操作都会有磁盘IO。日志量越大的pod,磁盘IO相应地也越高。
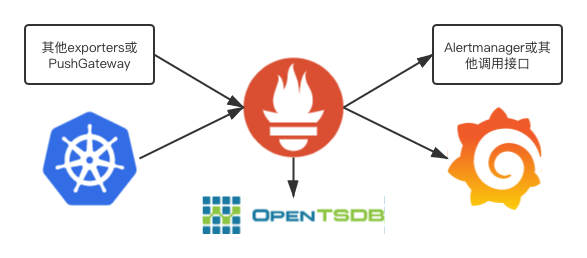
集群监控
普通pod监控采用了常见的Prometheus+Grafana的方案。
数据源计算方式
监控数据是采集的kubernetes中监控程序cadvisor上报的container_memory_working_set_bytes字段( 表格参照 )
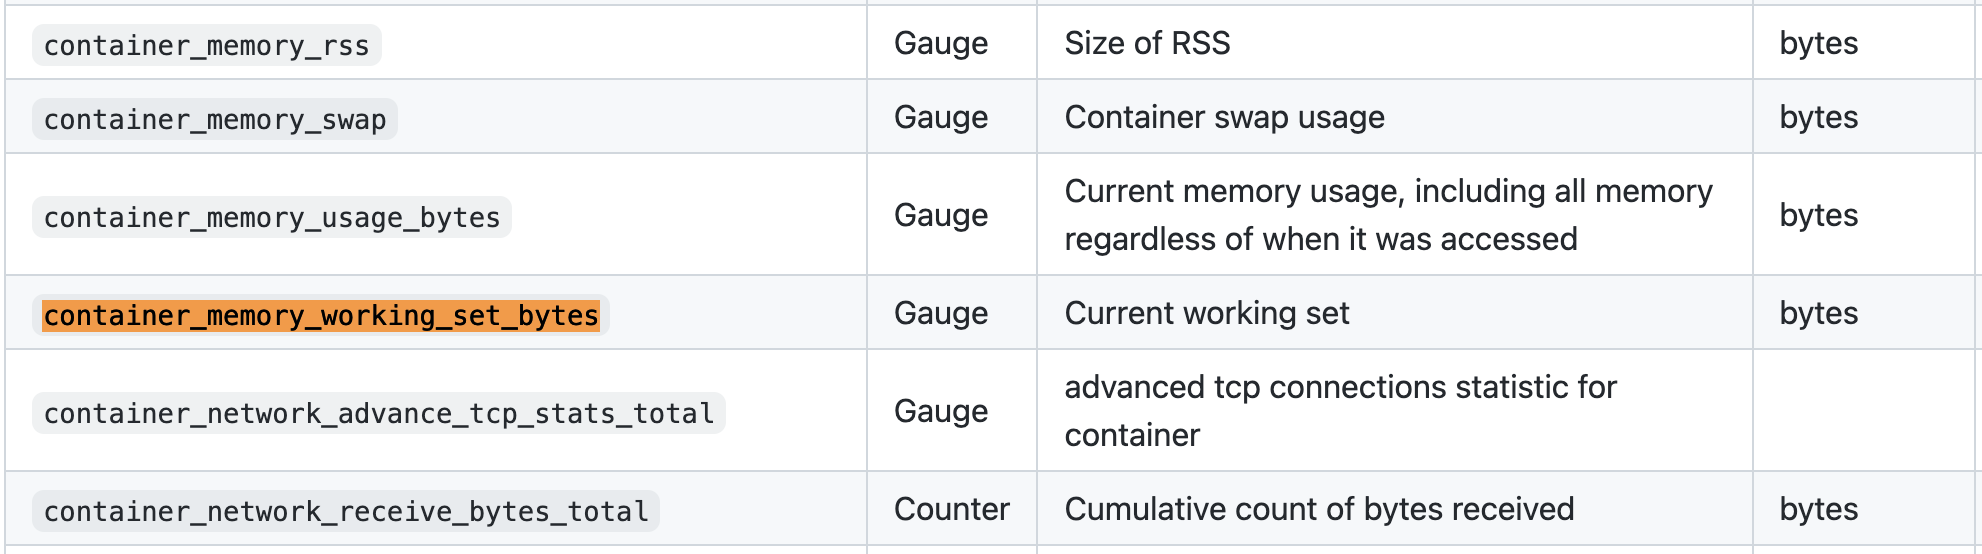
查看cadvisor源码中setMemoryStats
可知,container_memory_working_set_bytes字段是cgroup memory.usage_in_bytes(RSS + Cache)与memory.stat total_inactive_file二者的差值
func setMemoryStats(s *cgroups.Stats, ret *info.ContainerStats) {
	// ...

	// ...

	inactiveFileKeyName := "total_inactive_file"
	if cgroups.IsCgroup2UnifiedMode() {
		inactiveFileKeyName = "inactive_file"
	}

	workingSet := ret.Memory.Usage
	if v, ok := s.MemoryStats.Stats[inactiveFileKeyName]; ok {
		if workingSet < v {
			workingSet = 0
		} else {
			workingSet -= v
		}
	}
	ret.Memory.WorkingSet = workingSet
}
而memory.usage_in_bytes的统计数据是包含了所有的file cache的,total_active_file和total_inactive_file都属于file cache的一部分,
但是这两个数据并不是Pod中的程序真正占用的内存,只是系统为了提高磁盘IO的效率,将读写过的文件缓存在内存中。file cache并不会随着进程退出而释放,只会当容器销毁或者系统内存不足时才会由系统自动回收。
所以cadvisor采用memory.usage_in_bytes - total_inactive_file计算出的结果并不是当前Pod中程序所占用的内存,当Pod内存资源紧张时total_active_file也是可回收利用的。
验证结论
准备环境
去测试环境找到一个服务重启一下,并进入容器命令行
准备一个较大的文件
找一个比较大的文件,这里找了一个8M左右的日志文件
/app # ls -lah /data/log/xxxx.log
-rw-r--r--    1 root     root        8.2M May 31 10:54 /data/log/xxxx.log
查看内存数据
在容器中进入/sys/fs/cgroup/memory/目录,并查看cat memory.stat内容
/app # cd /sys/fs/cgroup/memory/
/sys/fs/cgroup/memory # cat memory.stat
cache 38195200
rss 13484032
rss_huge 0
mapped_file 495616
swap 0
pgpgin 1550811
pgpgout 1538194
pgfault 1512338
pgmajfault 36
inactive_anon 0
active_anon 13422592
inactive_file 12058624
active_file 26136576
unevictable 0
hierarchical_memory_limit 314572800
hierarchical_memsw_limit 314572800
total_cache 38195200
total_rss 13484032
total_rss_huge 0
total_mapped_file 495616
total_swap 0
total_pgpgin 1550811
total_pgpgout 1538194
total_pgfault 1512338
total_pgmajfault 36
total_inactive_anon 0
total_active_anon 13422592
total_inactive_file 12058624
total_active_file 26136576
total_unevictable 0
记录此时
total_inactive_file 12058624 Bytes = 11.5M
total_active_file 26136576 Bytes = 24.9M
遍历日志文件
/sys/fs/cgroup/memory # grep "hello" /data/log/xxx.log
第二次查看内存
/sys/fs/cgroup/memory # cat memory.stat
cache 46850048
rss 13500416
rss_huge 0
mapped_file 495616
swap 0
pgpgin 1552994
pgpgout 1538260
pgfault 1512642
pgmajfault 36
inactive_anon 0
active_anon 13459456
inactive_file 20709376
active_file 26140672
unevictable 0
hierarchical_memory_limit 314572800
hierarchical_memsw_limit 314572800
total_cache 46850048
total_rss 13500416
total_rss_huge 0
total_mapped_file 495616
total_swap 0
total_pgpgin 1552994
total_pgpgout 1538260
total_pgfault 1512642
total_pgmajfault 36
total_inactive_anon 0
total_active_anon 13459456
total_inactive_file 20709376
total_active_file 26140672
total_unevictable 0
记录此时
total_inactive_file 20709376 Bytes = 19.6M
total_active_file 26140672 Bytes = 24.9M
此时total_inactive_file占用较上次增加大约8M左右,即遍历过的日志文件的大小。
第二次遍历日志文件
对同一个文件第二次遍历访问
/sys/fs/cgroup/memory # grep "hello" /data/log/xxx.log
第三次查看内存
/sys/fs/cgroup/memory # cat memory.stat
cache 46850048
rss 13504512
rss_huge 0
mapped_file 495616
swap 0
pgpgin 1553058
pgpgout 1538323
pgfault 1512941
pgmajfault 36
inactive_anon 0
active_anon 13459456
inactive_file 12025856
active_file 34824192
unevictable 0
hierarchical_memory_limit 314572800
hierarchical_memsw_limit 314572800
total_cache 46850048
total_rss 13504512
total_rss_huge 0
total_mapped_file 495616
total_swap 0
total_pgpgin 1553058
total_pgpgout 1538323
total_pgfault 1512941
total_pgmajfault 36
total_inactive_anon 0
total_active_anon 13459456
total_inactive_file 12025856
total_active_file 34824192
total_unevictable 0
记录此时
total_inactive_file 12025856 Bytes = 11.5M
total_active_file 34824192 Bytes = 33.2M
此时total_inactive_file较上次减少8M,而total_active_file较上次增加8M
查看Grafana
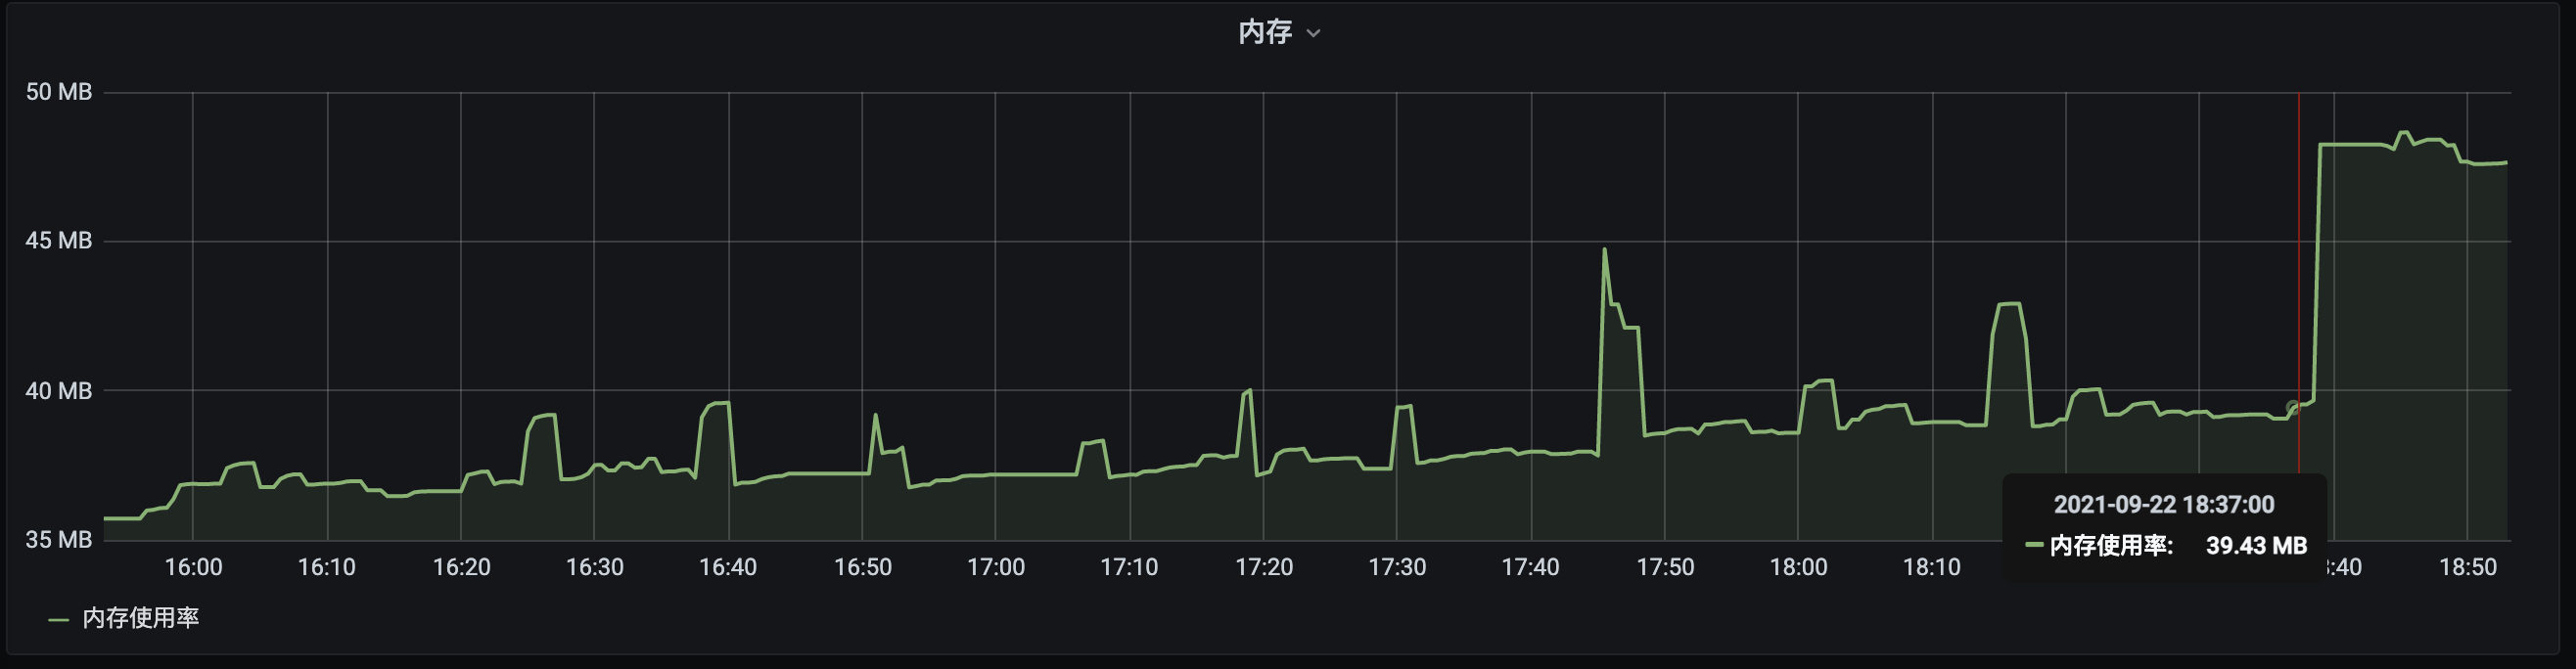
遍历日志文件之前
遍历日志文件之后
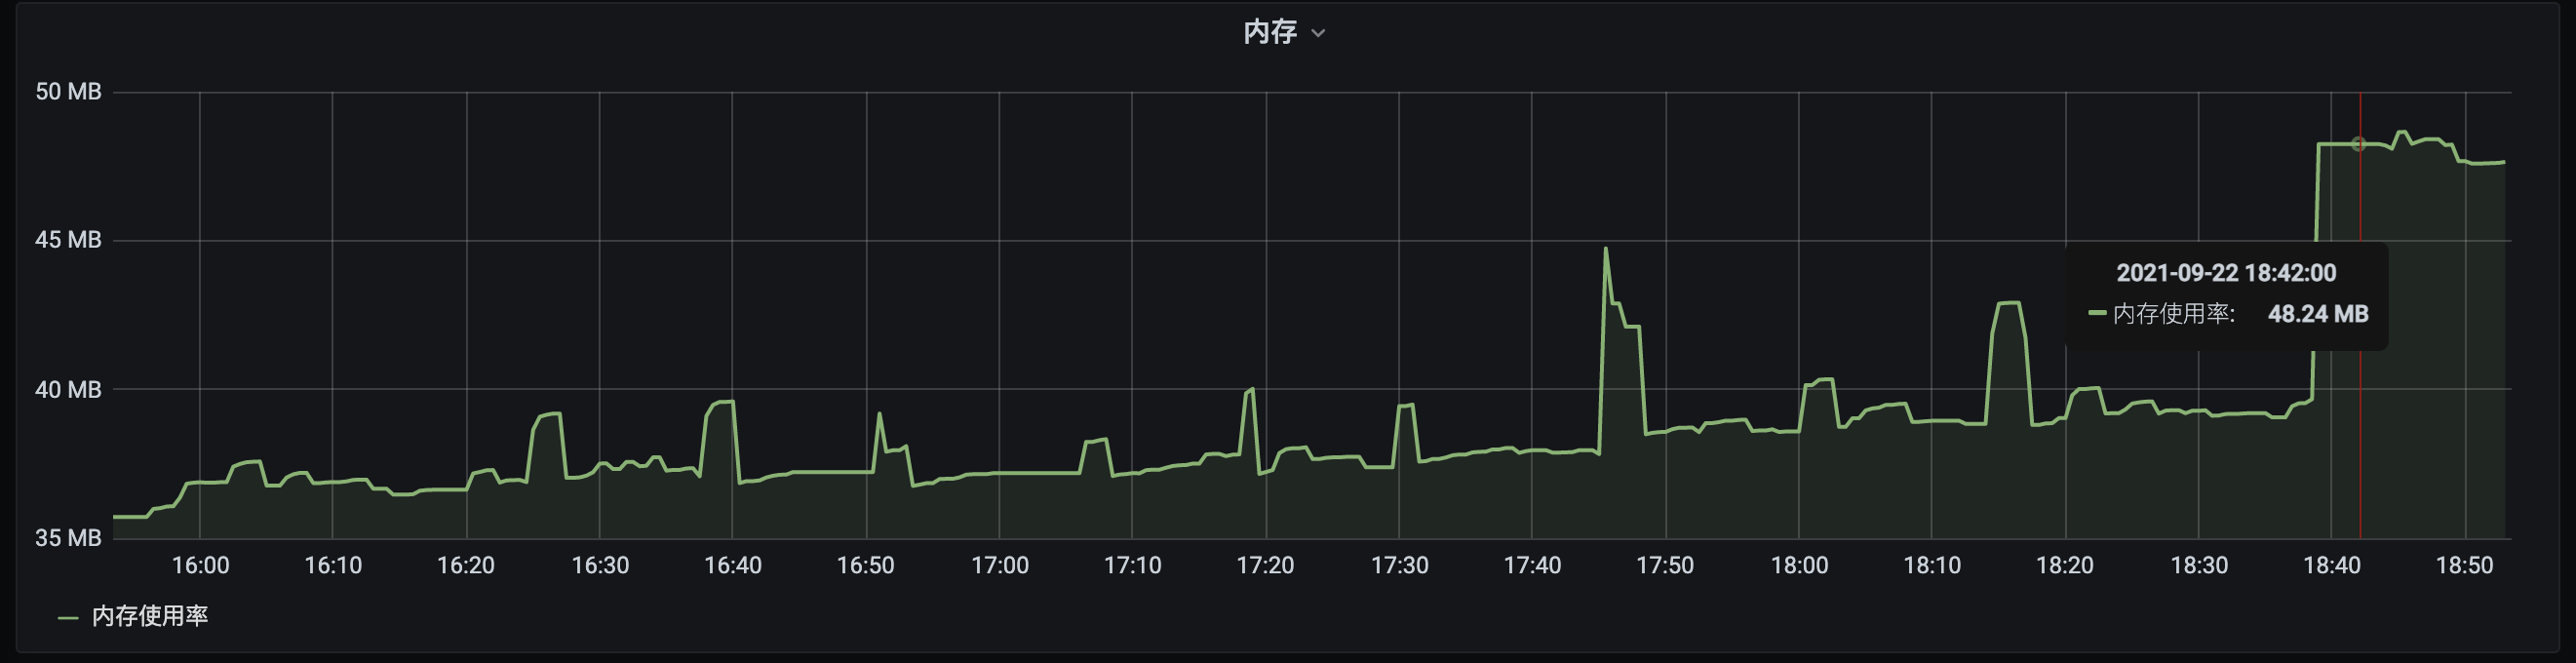
此时查看对应服务的Grafana面板可以看到,使用shell的grep命令遍历一个8M多的文件之后,在Pod中内存占用上升了大概8M。
而此时这块内存并没有被Pod中任何程序所引用,只是一个file cache的占用。
总结
根据上述实验结果可以印证内存持续增长但不会OOM的现象。服务启动并向磁盘中持续追加日志文件,随之file cache持续上涨,直至达到Pod的内存上限之后,会出现GC。
结论
memory.usage_in_bytes统计包含了Cached和Buffers,Cached中除了mlock_file和Shmem(IPCS shared memory & tmpfs)外,
其他部分file cache是可以回收使用的,Buffers也是可以回收利用的,所以Pod容器所在cgroup实际使用的内存计算公式可以转化为
(因memory.stat未导出SReclaimable,这里忽略SReclaimable):
real_used = memory.usage_in_bytes – (Cached- Shmem - mlock_file + Buffers )
          = memory.usage_in_bytes – memory.stat.total_active_file
因此cadvisor中container_memory_working_set_bytes字段在计算实际已使用内存时应该改为:
real_used = memory.usage_in_bytes – memory.stat.total_active_file
但是
过程中去kubernetes 的issue 中逛了一圈,发现了几个相关问题的讨论:
- https://github.com/kubernetes/kubernetes/issues/43916
- https://github.com/kubernetes/kubernetes/issues/104533
其中一个给我笑出声kubernetes should not count active_file as used memory, I have been waiting for 4 years!
等了四年了,这个问题还没有解决。也许,我们从一开始就错了?缓存也应该算是pod内存占用?